Over the past few weeks, an increasing number of market-focused articles and analyses have begun to discuss the U.S. Treasury yield curve, which was recently described by CNBC as “one of the most reliable recession indicators in the market”. And indeed, the yield curve’s history of predictions is an impressive one: each of the last 9 U.S. economic recessions (dating back to 1955) has been preceded by an inverted yield curve. That said, not all yield curve inversions are created equal, and like any market or economic indicator, the devil is often in the details.
We’ll take some time to consider the specifics of yield curve analysis, and what we should be looking out for over the next few months in the bond market, stock market, and the broader economy.
What is an inverted yield curve?
The yield curve is conceptually one of the simplest economic measures, merely plotting the current market interest rates at various maturities. In a “normal” economy, the yield curve tends to be upward sloping: shorter-term bonds have lower rates (yields), while longer-term bonds have higher yields. The higher yields on the longer-term bonds are usually assumed to compensate investors for a variety of additional risks compounded over the longer time horizons—uncertainty about future paths of inflation, economic growth, and broader interest rate trends, not to mention liquidity concerns for investors who are (at least theoretically) tying up their money for longer terms. But as economic cycles mature, the yield curve often begins to flatten, either because of direct Federal Reserve policy (usually an intentional increase in shorter-term rates in order to slow inflation in a booming economy), or simply due to changing investor preferences as risky assets rise to higher and higher valuations.
Eventually, a flattening yield curve can give way to an inverted yield curve, in which shorter-term bonds carry higher rates than longer-term bonds. The inverted yield curve can often send a warning signal to companies and market participants, but it also impacts investor behavior in a way that can create a self-fulfilling prophecy: if “risk-free” short-term Treasury bonds are paying higher rates than their riskier (longer-term and/or corporate) alternatives, then the benefits of lending money at longer terms (to companies and other borrowers who might need that money) are relatively weak. A decrease in investor risk appetite can then have impacts throughout the economy, as lending and borrowing patterns adjust to the changing interest rate environment.
The yield curve and the economy
While it’s hard to argue with an economic indicator that has a 9-for-9 record in predicting a recession, a few caveats must first be mentioned and considered. First, not all yield curve inversions look exactly alike: the shape of the curve can matter, and the degree to which the inversion has occurred can also be relevant. If shorter-term rates are only higher than longer-term rates by a fraction of a percent, that probably won’t have nearly as large an impact as an environment in which the gap between short and long-term rates is large, perhaps as much as a full percentage point or more. In addition, it is often possible for a portion of the yield curve to invert, without a “full” inversion. That is, in fact, the situation that currently exists in the bond market: Treasury bonds with maturities from 3 months out to 10 years are essentially flat (with a slight negative slope), but 30-year bonds still yield more than 10-year bonds, and 10-year bonds also yield more than their 2-year counterparts. The current situation, then, is best described as a partially inverted yield curve, and a very mild inversion at that. At least at the moment, there’s no need for any investor panic.
Even if the yield curve were fully (and significantly) inverted, though, the effects on the economy could still be muted, and at least delayed. Even during its period of perfect recession predictions, the average lag between a yield curve inversion and a stock market peak has been 8 months, with an average lag of 14 months before the onset of the ensuing recession.
The market and the economy
In any case, it’s important to mention that confusing the economy for the stock market is one of the most common investor errors. Even a booming economy can yield tepid stock market returns, while one in recession can still experience stock market gains. The two will normally track together over longer time horizons, but in the short-term, a lot of noise can enter the equation. Just in the last two years, we saw this dynamic at work in real time. In 2017, GDP grew by a relatively tepid 2.3%, but the S&P 500 grew by 19%. Last year, GDP growth accelerated to as high as 4.2% in the second quarter, but the market struggled, ending the year with a 6.2% loss.
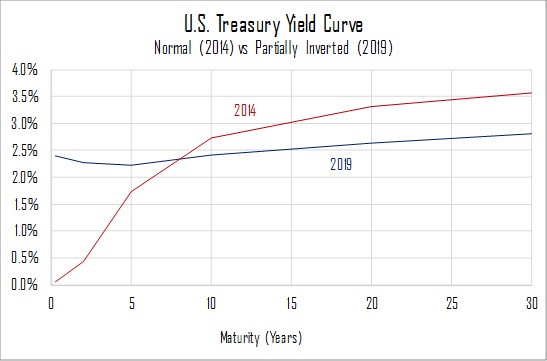
Source: U.S. Treasury
Similar (but more dramatic) dynamics were at play leading into both the dot-com crash and the financial crisis that marked our most recent recessions; in 2000 and 2007, the stock market peaked (and swiftly declined) long before the economy was officially in recession. In both cases, there’s a strong case to be made that the cause-and-effect actually operated in the opposite direction: it was the stock market that caused (or exacerbated) the downswing in the economy, and not the other way around.
All of these dynamics point to a strategy of being proactive with portfolio construction and rebalancing, rather than reactive; if you wait until the economy and market are flashing red warning signals, the time for action has usually passed, and corrective measures can become counter-productive. Therefore, we typically recommend continuing to rebalance portfolios regularly, keeping a portion of assets in safer investments at all times (in order to have the ability to respond to opportunities if and when risk asset prices correct), and minimizing our exposure to any one aspect or area of the global economic cycle.
Stock prices are generally forward-looking, and they take into account a wide array of economic variables and considerations. Yes, economic indicators (and overall economic growth trajectories) have a significant impact on corporate earnings, but they are far from the only factor at play. Geopolitical factors (think trade), tax policy, laws and regulations regarding corporate financing strategies, labor-versus-capital tradeoffs (think minimum wage policies), and other factors can all have an impact on the share of economic growth that generates corporate profitability and subsequent stock market gains. Focusing on just one factor (or economic indicator) at the exclusion of all others is rarely rewarded.